WEB3 · DEFI · GAMEFI · NFT
Independent Tokenomics Audit & Web3 Economic Modeling
Independent analysis of tokenomics, financial sustainability and economic mechanisms for Web3, DeFi, GameFi, NFT and Telegram Mini Apps.
Mathematical modeling, stress testing and economic risk analysis before launch or expansion.
- Independent economic assessment
- Mathematical modeling and stress tests
- Token, reward and cash-flow analysis
- Actionable risk mitigation recommendations
Economic models I analyse
Scope follows your project’s mechanisms. I connect participant incentives, token supply, cash flows and obligations in one economic model.
Tokenomics / Token Launch
Issuance, total and circulating supply, allocations, vesting and unlock schedules. I examine inflation, deflation, participant incentives and changes in available supply.
GameFi / Play-to-Earn
Core gameplay loops, reward economies, resource creation and sinks. I assess game inflation, Play-to-Earn sustainability, economic exploits, bots and farming.
DeFi
Protocol economics, liquidity incentives, staking rewards and yield sustainability. I review treasury management, falling TVL and the funding of incentives.
NFT Economy
Mint pricing, supply mechanics, utility, reward distribution, secondary markets and royalties. I test demand assumptions and long-term obligations.
Telegram Mini Apps / TON
Telegram Stars, permitted TON payment flows, rewarded ads, AdsGram and alternatives. I analyse monetisation, antifraud, game mechanics and growing DAU.
DAO / Treasury
Governance incentives, budgets and reward allocation. I examine treasury runway and scenarios for changing revenue and expenditure.
A DeFi economic audit or token economic audit does not replace smart contract or application security testing. Conclusions apply to the data, assumptions and scenarios actually examined.
Economic risks I investigate
Supply pressure
Overlapping team, investor and reward unlocks; increasing available supply without evidence of matching demand.
Unsustainable incentives
Rewards depend on new issuance, rising TVL or continuous user acquisition. I test what happens when growth stops.
Cash and liquidity gaps
Accrued obligations, cash balances and liquid reserves are separate. I examine settlement timing and concentrated withdrawals.
Economic abuse
Farming, multiple accounts and exploitable reward incentives. I compare potential extraction with the cost of participation.
Concentration and governance
Large allocations, uneven incentives and a treasury dependent on too few funding sources.
Weak monetisation
Protocol or product revenue fails to cover costs and agreed obligations. I examine unit economics and parameter sensitivity.
Model the economy before risks turn into losses
Test economic hypotheses with mathematical models, inspect parameter sensitivity and calculate the impact of adverse scenarios.
Every value below is an illustrative assumption, not a client audit result, an ad-network rate or a token price forecast.
Scenario 1. Token Supply & Vesting
Fixed total supply: 100,000,000 tokens. Initial circulating supply: 10,000,000 tokens (10%). Horizon: 24 months. Each allocation has an explicit release schedule.
| Allocation | Share | Release schedule |
|---|---|---|
| Launch liquidity | 10% | 10 million at month 0; no further releases. |
| Team | 20% | Six-month cliff; 20 million in 18 equal instalments in months 7–24. |
| Investors | 15% | Three-month cliff; 15 million in 21 equal instalments in months 4–24. |
| Community rewards | 35% | 35 million in 24 equal instalments in months 1–24. |
| Treasury | 20% | Locked throughout the 24-month horizon; excluded from circulation in this scenario. |
Circulating(m) = 10m + 20m × max(0, m − 6) / 18 + 15m × max(0, m − 3) / 21 + 35m × m / 24, for m = 0…24.
Allocations total 100% by including the separate 10% launch allocation. This simulation treats every unlocked token as available to circulate. Unlocks are not actual sales: demand, holder behaviour and liquidity are not modeled. Monthly releases step up in months 4 and 7. Vesting alone does not predict token price.
Underlying chart data: all 25 observations
| Month | Circulating supply, tokens | Released this month, tokens |
|---|---|---|
| 0 | 10,000,000 | 10,000,000 |
| 1 | 11,458,333.33 | 1,458,333.33 |
| 2 | 12,916,666.67 | 1,458,333.33 |
| 3 | 14,375,000 | 1,458,333.33 |
| 4 | 16,547,619.05 | 2,172,619.05 |
| 5 | 18,720,238.1 | 2,172,619.05 |
| 6 | 20,892,857.14 | 2,172,619.05 |
| 7 | 24,176,587.3 | 3,283,730.16 |
| 8 | 27,460,317.46 | 3,283,730.16 |
| 9 | 30,744,047.62 | 3,283,730.16 |
| 10 | 34,027,777.78 | 3,283,730.16 |
| 11 | 37,311,507.94 | 3,283,730.16 |
| 12 | 40,595,238.1 | 3,283,730.16 |
| 13 | 43,878,968.25 | 3,283,730.16 |
| 14 | 47,162,698.41 | 3,283,730.16 |
| 15 | 50,446,428.57 | 3,283,730.16 |
| 16 | 53,730,158.73 | 3,283,730.16 |
| 17 | 57,013,888.89 | 3,283,730.16 |
| 18 | 60,297,619.05 | 3,283,730.16 |
| 19 | 63,581,349.21 | 3,283,730.16 |
| 20 | 66,865,079.37 | 3,283,730.16 |
| 21 | 70,148,809.52 | 3,283,730.16 |
| 22 | 73,432,539.68 | 3,283,730.16 |
| 23 | 76,716,269.84 | 3,283,730.16 |
| 24 | 80,000,000 | 3,283,730.16 |
Scenario 2. GameFi Economy
The existing Telegram Mini Apps / TON example is retained: rewarded advertising, rewards, operating costs, bot-farming risk and stress tests. Inputs can now be recalculated on the page.
Interactive GameFi calculation
Advertising is calculated over seven days; project rewards and costs are USD per week. Bot-farm economics use USD per day. The farm is a separate model and is not deducted a second time from the project reward budget. All inputs are hypothetical.
Impressions = DAU × views × 7 × fill rate × payable share. Revenue = impressions / 1,000 × CPM. Cash balance = revenue − rewards − operating costs. Farm result = min(accounts × accrual × eligible share, cap) − operating costs − withdrawal costs.
Original examples and extended GameFi audit scope
Original GameFi calculations
15,000 DAU × 5 potential views per day = 75,000 potential views daily and 525,000 weekly.
Potential views are not payable impressions
Payable impressions = DAU × daily views × days × fill rate × payable share after filling. Revenue = payable impressions / 1,000 × publisher effective CPM.
| Scenario | Fill rate | Payable share | CPM, USD | Payable impressions | Revenue, USD/week |
|---|---|---|---|---|---|
| Pessimistic | 30% | 80% | 0.50 | 126,000 | 63 |
| Base | 60% | 90% | 1 | 283,500 | 283.50 |
| Optimistic | 85% | 95% | 2 | 423,937.5 | 847.88 |
Fill rates, payable shares and CPMs are illustrative. If a network’s eCPM already includes unfilled requests, applying fill rate again would double-count the reduction. Infrastructure, reward payouts, taxes and other costs are excluded from this revenue table.
Illustrative 1,000-account farm
1,000 accounts × 2 points daily × USD 0.02 per point = USD 40 nominal daily accrual. These are hypothetical points, not a token quotation.
Assume 25% is eligible for withdrawal, a USD 8 aggregate daily payout cap, USD 9 daily operating cost and USD 1 withdrawal cost. Farm result = min(40 × 25%, 8) − 9 − 1 = −2 USD/day.
The break-even condition is available payout ≤ operating and withdrawal costs. This example does not prove antifraud protection: eligibility, costs and the enforceability of caps must be tested.
Extended GameFi audit scope
Specialist checks selected for the game’s actual mechanisms.
Token and reward mechanics
Issuance, burns, staking, accrual speed, inflation, deflation and dependence on new players.
Game economy
Core loop, Free-to-Play, Play-to-Earn, shop, rarity, crafting, multipliers, tournaments and leaderboards.
Stars and TON
Stars rewards through Fragment, permitted TON/USDT flows, TON Connect, conversion, refunds, settlement timing and net receipts. Digital goods inside Telegram require Stars; fees depend on the actual flow.
Economic antifraud
Farms of 100, 1,000 and 10,000 accounts, bonus and referral abuse, limits, withdrawals and attack break-even.
Rewarded ads
AdsGram and alternatives, CPM, fill, payable impressions, traffic quality, DAU, revenue per user and infrastructure costs.
Stress testing
1,000 / 5,000 / 15,000 / 30,000 DAU, paying conversion, more bots, weaker CPM, higher costs and payouts.
GameFi calculation methodology
Separate measured data from assumptions.
Model assets and obligations
Opening asset stock + issuance − burns; account for user assets and project cash separately.
Test bot-farm profitability
Compare available payouts with participation and withdrawal costs, then test whether caps can actually be enforced.
Test Play-to-Earn sustainability
Compare net revenue with costs and obligations, including a no-growth user scenario.
Calculate Stars proceeds
Use developer reward terms, refunds, conversion and settlement timing. The user’s Stars purchase price is not developer revenue.
Stress-test combined shocks
Vary DAU, conversion, CPM, bots, costs and payouts together; check when cash reserves are exhausted.
Reconcile expenses
Account for rewards, hosting, acquisition, support and fees without deducting the same charge twice.
Scenario 3. DeFi / Staking
A 24-month illustration. Base TVL: USD 1,000,000; monthly protocol revenue: USD 8,000; cash operating costs: USD 6,000; opening cash treasury: USD 50,000.
Reward rate: 12% annual simple rate, calculated monthly without compounding. Rewards are paid in tokens. An assumed conversion of USD 0.50 per reward token is constant in every scenario. It is a unit-conversion assumption, not a price forecast. Token issuance does not itself reduce the cash treasury; cash purchases of reward tokens are zero in this illustration.
| Scenario | TVL, USD | Revenue, USD/month | Rewards, tokens/month | Reward valuation, USD/month | Cash balance, USD/month | Economic balance*, USD/month | Cash reserve, USD (month 24) |
|---|---|---|---|---|---|---|---|
| Base | 1,000,000 | 8,000 | 20,000 | 10,000 | 2,000 | -8,000 | 98,000 |
| TVL −30% | 700,000 | 5,600 | 14,000 | 7,000 | -400 | -7,400 | 40,400 |
| Revenue −50% | 1,000,000 | 4,000 | 20,000 | 10,000 | -2,000 | -12,000 | 2,000 |
* Economic balance = revenue − cash operating costs − assumed token reward valuation. This analytical measure is not accounting cash flow. Cash balance = revenue − cash operating costs. Reserve(m) = 50,000 + m × cash balance. With TVL down 30%, revenue and rewards both fall proportionally; operating costs stay fixed. With revenue down 50%, TVL and reward rules are unchanged. No compounding, exchange-rate changes or extra treasury funding are assumed.
Monthly cash reserve data
| Month | Base · USD | TVL −30% · USD | Revenue −50% · USD |
|---|---|---|---|
| 0 | 50,000 | 50,000 | 50,000 |
| 1 | 52,000 | 49,600 | 48,000 |
| 2 | 54,000 | 49,200 | 46,000 |
| 3 | 56,000 | 48,800 | 44,000 |
| 4 | 58,000 | 48,400 | 42,000 |
| 5 | 60,000 | 48,000 | 40,000 |
| 6 | 62,000 | 47,600 | 38,000 |
| 7 | 64,000 | 47,200 | 36,000 |
| 8 | 66,000 | 46,800 | 34,000 |
| 9 | 68,000 | 46,400 | 32,000 |
| 10 | 70,000 | 46,000 | 30,000 |
| 11 | 72,000 | 45,600 | 28,000 |
| 12 | 74,000 | 45,200 | 26,000 |
| 13 | 76,000 | 44,800 | 24,000 |
| 14 | 78,000 | 44,400 | 22,000 |
| 15 | 80,000 | 44,000 | 20,000 |
| 16 | 82,000 | 43,600 | 18,000 |
| 17 | 84,000 | 43,200 | 16,000 |
| 18 | 86,000 | 42,800 | 14,000 |
| 19 | 88,000 | 42,400 | 12,000 |
| 20 | 90,000 | 42,000 | 10,000 |
| 21 | 92,000 | 41,600 | 8,000 |
| 22 | 94,000 | 41,200 | 6,000 |
| 23 | 96,000 | 40,800 | 4,000 |
| 24 | 98,000 | 40,400 | 2,000 |
AI and MCP for economic model analysis
I use software tools and AI to explore economic scenarios, inspect model parameters and investigate potential risks. MCP connects modeling tools to compatible AI clients so calculations can be handled as structured data.
Tokenomics Analysis
Supply · Vesting · Unlock Schedule · Inflation
GameFi Simulation
Rewards · DAU · Monetization · Economic Balance
DeFi Modeling
TVL · Rewards · Treasury · Revenue
Stress Testing
Bear Market · Revenue Decline · User Growth · Reward Inflation
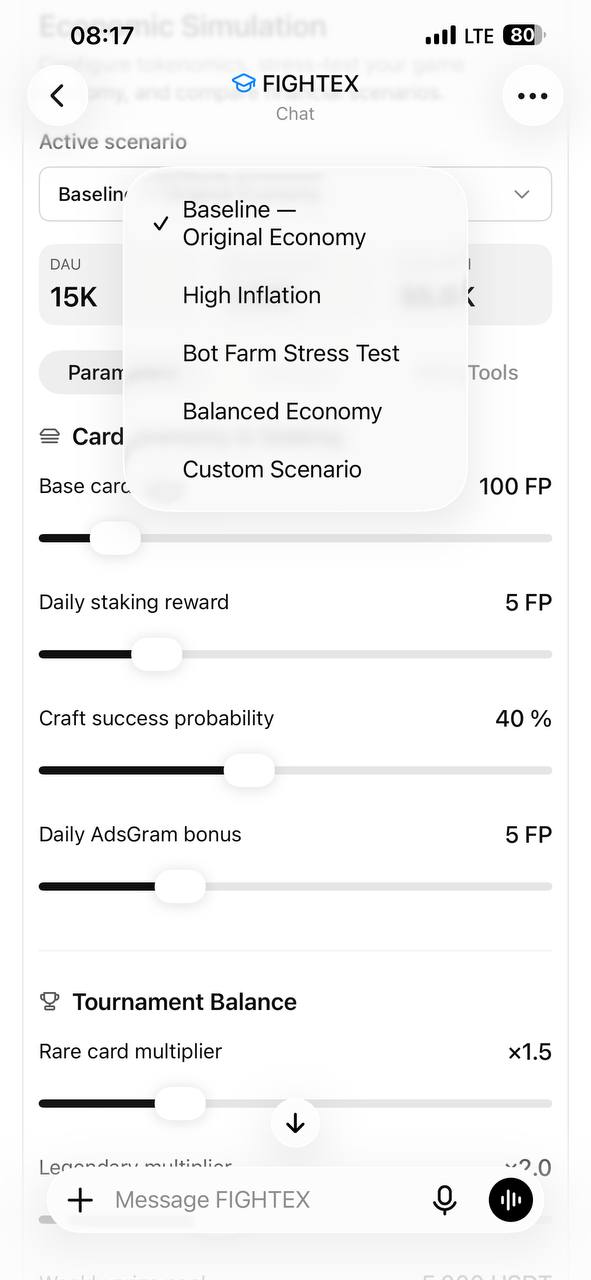
Tool scope, client support and data access are verified for each project. AI does not replace formulas or validation. The charts on this page are deterministic and need no MCP connection. The screenshots show a separate game-model interface with a fictional name, not proof of a universal, ready-made MCP product.
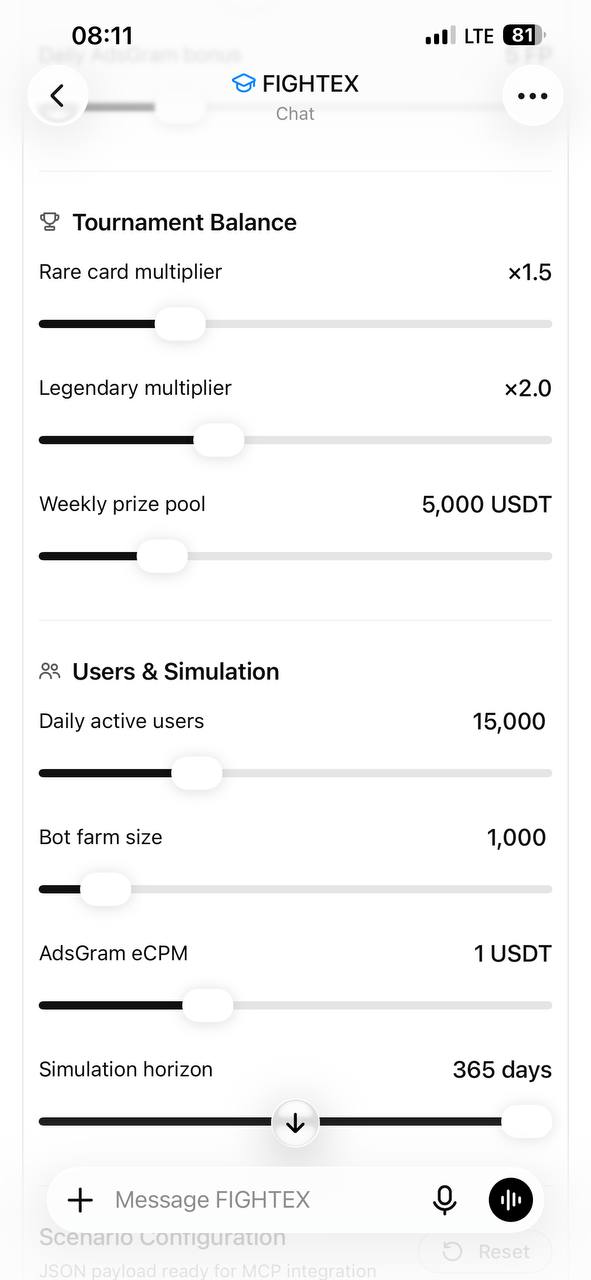
Game model parameters
Audience and model horizon
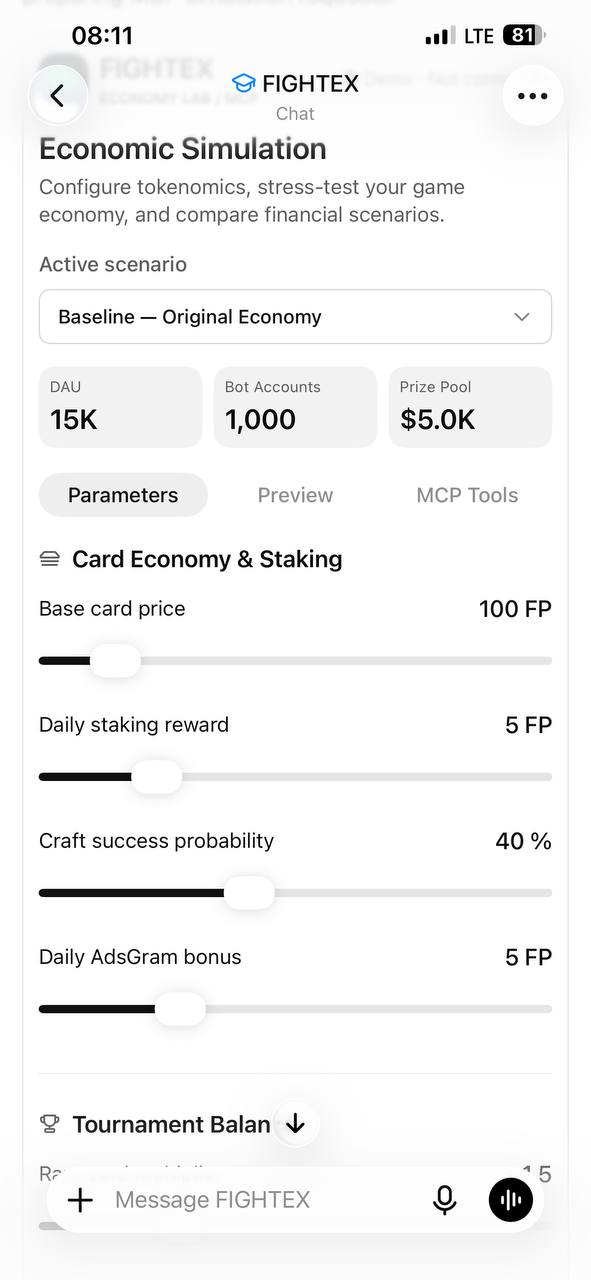
Parameter controls
How a tokenomics audit is conducted
Review the economic model
Examine the whitepaper, tokenomics documentation, financial model, business logic, reward mechanisms and token distribution.
Verify the mathematics
Check formulas, assumptions, revenue and obligation balances, participant incentives and internal contradictions.
Stress-test scenarios
Model falling revenue, growing activity, concentrated withdrawals, rising issuance, reduced liquidity and adverse markets. Scenario selection follows the project type.
Recommend and reassess
Prioritise findings, propose parameter changes, rerun the relevant models and deliver the written report.
What an independent audit delivers
No guaranteed returns, token appreciation or absence of economic risks is promised. Unknown inputs and limitations are documented explicitly.
- An economic model report
- A register of identified risks
- Verification of key mathematical assumptions
- Stress-test results
- Parameter-change scenarios
- Recommendations for improving the model
- Financial sustainability conclusions within the tested assumptions
Tools and project context
Selected for the actual model; not every project needs every item.
- Web3
- DeFi
- Tokenomics
- NFT
- DAO / Treasury
- GameFi
- Telegram Mini Apps
- TON
- TON Connect
- Telegram Stars
- Fragment
- USDT
- AdsGram
- Play-to-Earn
- Fantasy Sports
- Python
- PostgreSQL
- MCP
Tokenomics audit pricing
Scope, fees and timing follow a review of your documentation, mechanism count, unlock schedules, payment channels and modeling depth.
Web3 economic audit questions
What is a tokenomics audit?
An independent review of token issuance, allocation and circulation, participant incentives and related financial flows. A token economic audit combines formula verification, assumption review and tokenomics stress testing.
Why does a Web3 project need an economic audit?
Technically correct software may still have unsustainable rewards, inadequate reserves or conflicting incentives. A Web3 economic audit helps reveal these dependencies before launch and expansion.
What is the difference between tokenomics and smart contract audits?
Tokenomics audits examine economic rules and sustainability. Smart contract audits examine implementation and code vulnerabilities. DeFi economic modeling does not certify smart contract security.
How do you test token economy sustainability?
Reconcile inflows, expenditure and obligations over time, review supply and demand assumptions, and rerun adverse scenarios. Token issuance is accounted for separately from cash expenditure.
Can tokenomics be audited before token launch?
Yes. Allocations, token vesting analysis, incentives and treasury needs can be examined before issuance. Conclusions depend on documentation and explicitly stated assumptions.
What data is required for a tokenomics audit?
A whitepaper, allocation table, total and circulating supply, unlock schedule, reward rules, financial model, costs and payment terms. An operating project also benefits from anonymised transaction and cohort data.
What does token supply simulation reveal?
The timing and volume of newly available tokens, overlapping unlocks and inflation scenarios. A token supply simulation alone does not predict market prices.
Do you cover GameFi, NFTs and Telegram Mini Apps?
Yes, as individual audit specialisations: rewards and sinks, minting, utility and royalties, DAU, ads, Stars, TON and antifraud. The GameFi economy audit examples are retained in their own section.
How do you evaluate staking rewards?
Separate protocol revenue, cash payments, expenses and token reward issuance. DeFi analysis covers falling TVL, weaker revenue and treasury depletion; valuation assumptions are stated explicitly.
Does an audit guarantee profit or token appreciation?
No. Tokenomics modeling calculates the consequences of stated conditions. Markets, implementation and participant behaviour can differ; the report specifies the limits of its conclusions.
Is source code required?
An economic concept can be audited without code. Confirming that limits, authorisation and reward rules are actually enforced requires a separate technical review.
Can the report support a development specification?
Yes. Findings can become accrual rules, limits, data requirements, retry controls and testable acceptance criteria for the engineering team.
Related case studies and reading
FIGHTEX: economy and tokenomics simulatorAn example of game economy modelling and scenario testing.
Choosing a TON staking architectureDiscuss the scope and approach for a similar task.
WEB3 / TOKENOMICS AUDIT
Review your economic model before launch or expansion
Describe your Web3 project, token mechanisms and concerns. I will agree on the inputs, scenarios and scope of an independent report.
@ifwcomMessage on TelegramDocumentation and confidentiality terms are arranged separately.
Discuss an audit
Do not submit private keys, passwords or confidential documents through this form.